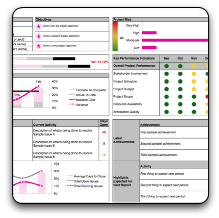
 I know my company sells project tracking services, but I’m the first to admit that some projects aren’t complex enough to need what I sell. So for folks out there who want a centralized way of keeping track of all your data, I offer you this bad boy for free!
If you’re familiar with PMI recommendations for keeping track of projects, or you need a way to perform Earned Value Analysis (EVA), everything you need is right here.
Every project I make up one of these, even if there’s a portfolio management system in place. Those big enterprise systems CAN handle much of this data but they’re not always the easiest to use, and sometimes, I just want something to play around with that doesn’t require a login. My other issue with portfolio management systems is that, as much intelligence can be built into them, sometimes I need to see more. Because this file is in Excel, it prints out, is easy to photocopy and bring along to meetings (shh! don’t tell the FSC!). Some clients are satisfied with a simple dashboard; others demand more detail. From a generic project perspective, everything they could need to see is right here (and it’s up to you what you do or don’t put on the table).
Inside this file, you’ll find the following sections:
- A tab for milestones, where you can break your project into high level phases. This tab shows you relevant EVA data to your milestones if you need it, automatically filled in from your other tabs.
- A tasks tab where you can enter the tasks in your project. You can set baseline information, and actual/revised dates. It even makes suggestions on new dates if one of your tasks slips.
- A resource tab where you can enter all your project resources. This isn’t just people, it can be equipment or materials as well. Your resource rates go here, and that will calculate your project costs.
- A detailed cost worksheet. This is where you would do the bulk of your work. Enter your baseline data, and then make modifications as you go through your project. If you have a lot of information here, use the autofilter buttons at the top to simplify your view.
- A change request log.
- A quality log.
- An issues log, colour coded by severity, where you can monitor current activity and have a log of resolutions in case the issue crops up again. It also tracks the number of days to close issues.
- A risk log to plan risk responses, that generates a (simple) risk score before and after mitigations.
- A complete dashboard that tracks all aspects of your project on a single page to give your stakeholders.
I hope you enjoy this file. You’re free to use it however you like, and pass it around. You don’t even need to attribute it to Papercut, although hugs are free if you do! 🙂
