 Okay, let’s say you have a bunch of projects on the go, your portfolio management system is too clunky (or you don’t have one), and you need to do some “what-if” analysis.
You have one pool of Business Analysts, Developers and Testers and up to five projects. How do they all fit together? To get all these projects done, how many resources do you really need? What happens to your other projects if one of your projects is late by a week? What happens if you lose someone?
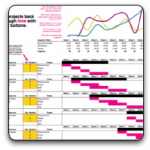
Enter the durations of your projects, and the number of each type of resource. Use the slider buttons to move your projects back and forth through time. When you do that, the graph at the top will change. If any of the lines in the graph go over the capacity line, you have a problem.
You have a limited ability to change the assumptions that go into this worksheet on the second tab (it is quick and dirty after all).
UPDATE: If you found this page through a web search, this version of my capacity planning workbook is really just proof of concept and very limited in functionality. There’s a vastly superior version of this file over here. My new version contains support for up to 25 projects, 10 resource types, and unique phase makeups for every project in your portfolio. Why not check it out?


