I was reading up on project failure statistics this weekend as I often need to remind my clients about the harsh realities of project management when entering into a new project. While I don’t like to scare my clients, I still hear “oh we’ll figure that out later” from stakeholders and sponsors when trying to nail scope down at the start of a project. I like to put things in proper perspective.
Many of us are familiar with the Standish Group’s Chaos Report. Indeed, it’s the source I was planning to use in my research. But this weekend I came across a relatively new white paper called “The IT Complexity Crisis: Danger and Opportunity” by Roger Sessions.
This paper is the first real attempt I’ve seen that puts solid dollar estimates behind the cost of IT project failures. I think he takes a lot of liberties to get his numbers, but the logic he uses is reasoned. When dealing with numbers of this scale it’s hard to be accurate. He asks in his white paper that we “don’t get overly focused on the exact amounts…the real point is not the exact numbers, but the magnitude of the numbers and the fact that the numbers are getting worse”.
I very much enjoyed Mr. Sessions’ paper. Over the next few posts I’ll be kicking out a few different ways of looking at his thoughts, starting from his assumptions, and working through his recommendations.
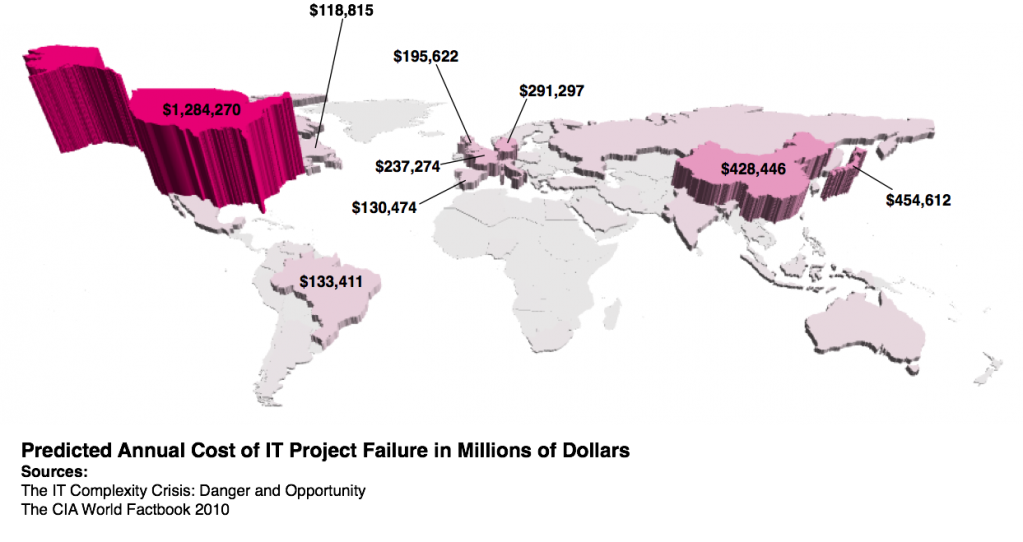
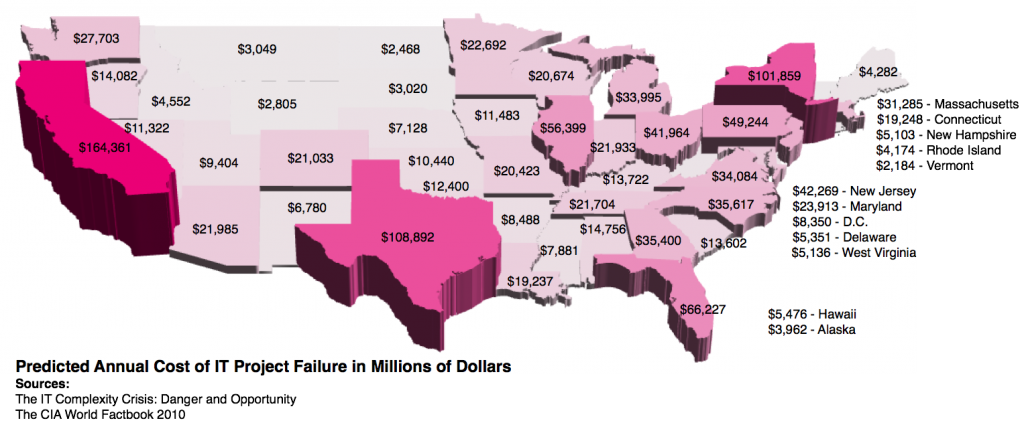
For today’s post, I took his predicted cost of annual IT failure, which is 8.9% of any country’s GDP (that’s just *huge*). I pulled worldwide GDP figures from the latest CIA World Factbook which is why my numbers differ slightly from his. The results are as follows (click for a larger view):

It’s not hard to see who the winner(?) is. Data for these maps is in the attached Excel spreadsheet, Project Failure Rates Derived From GDP.
According to these calculations, the United States wastes $1.2 trillion dollars every year on failed technology projects. I had to figure that out by counting off commas. This isn’t a one-off occurrence. If these estimates are even close to accurate, each and every year, companies in the United States take over a trillion of their hard-earned dollars and burn it. Worldwide? We’re talking $6.2 trillion.
In the United States, California is the top burner, with $164 billion a year getting sucked up on IT failures, Texas consumes $108 billion a year, and New York chews up $101 billion a year.
Related articles by Zemanta
- Garbage In, Garbage Out. Haven’t We Learned That Yet? (edge.papercutpm.com)
- eXtreme Project Management. Both Brilliant and Dangerous. (edge.papercutpm.com)
- The Importance of Precision (edge.papercutpm.com)
- What Are the Steps of Implementing a Project? (business-project-management.suite101.com)
- Estimation is a life cycle and living process ” Adventures in Project Management (linusfernandes.com)
- Law of a Traction (iowabiz.com)
- The Looming Obama Debt Disaster (powerlineblog.com)
- We met the date… because it passed on the calendar ” Adventures in Project Management (linusfernandes.com)


![Reblog this post [with Zemanta]](http://img.zemanta.com/reblog_e.png?x-id=255fa343-cfb8-45b7-9a9d-693e0061e66b)